Most financial advisors have a strong aversion to trying to understand their website’s metrics through Google Analytics. Why is this, when we know advisors tend to be numbers-driven and analytical in nature? Our best guess is because Google Analytics is jargon-rich, confusing, and overwhelming. In an effort to provide users with all the data they’ll ever need, the analytics platform can be difficult to sift through or find anything meaningful.
However, advisors may be more inclined to use Google Analytics if they realize that they really only need to know three things about their website when getting started:
1. How much traffic is coming to the advisor’s site?
2. Who is that traffic made up of?
3. What are those visitors doing?
Getting these three pieces of information is really simple; just follow these easy steps!
How Much Traffic Is Coming To The Advisor’s Site?
To get started answering this question, follow these steps:
- Log in to Google Analytics.
- Select the property (website) you want to view data for.
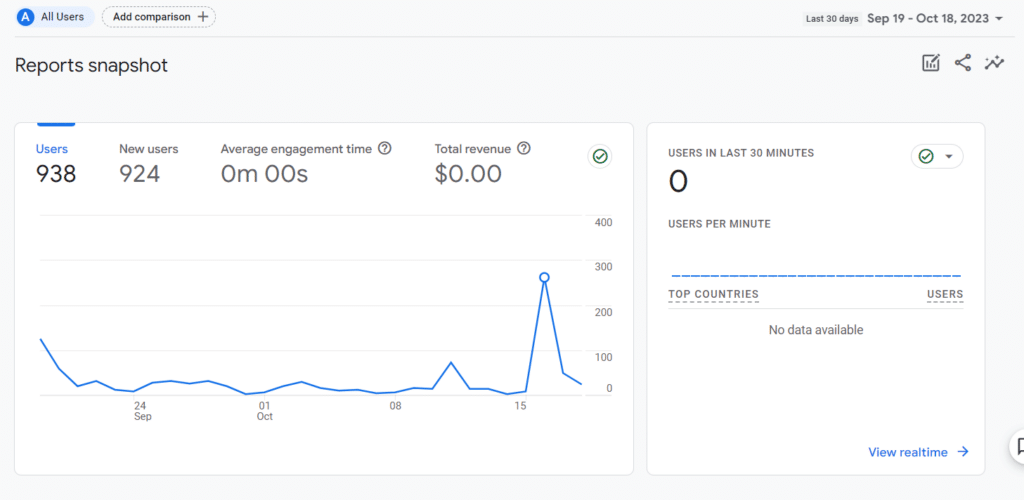
- The default report on the home page will display an overview of total users for the last 6 days.
- In the top right dropdown menu, select a date range (try the last 30 days).

This answers the question “How much traffic is coming to the advisor’s site?” For our example advisor, 938 users have visited the site in the past month. That’s not terrible, considering this is the advisor’s old site that has not been optimized for SEO and has no integrated marketing. However, in the next step, we will quickly learn that the total traffic does not tell the whole story.
Who Does That Traffic Represent?
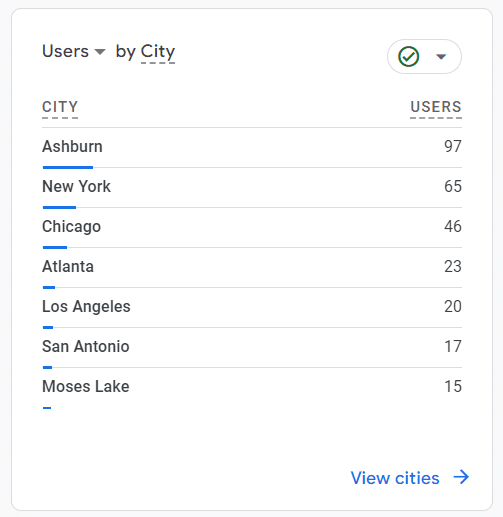
This is where it starts to get interesting. To learn who this traffic represents, in the left-hand menu, select “Demographic details” under User Attributes. More than likely the majority of traffic should come from the United States unless you provide services in other countries; so to gain more insight, click on the blue plus sign to the right of the “Country” heading, hover over “Geography,” and select the city data attribute.

Of the folks visiting the site from the United states, only 4% are from Chicago, which is where this advisor does business. This is a good indicator that this advisor’s site could use some SEO optimization geared toward their office location.
What Are Those Visitors Doing?
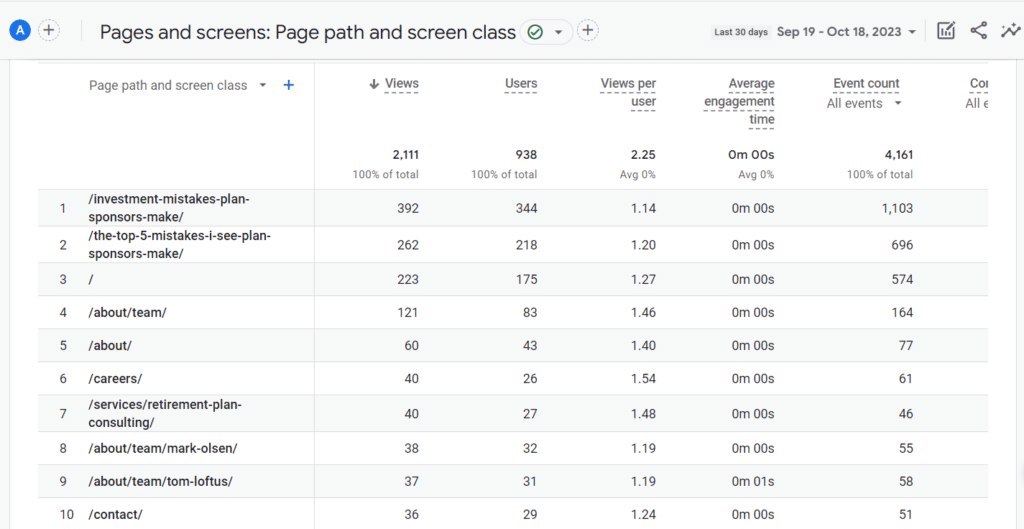
To find out more about the site visitors’ behavior, navigate to “Engagement” then “Pages and screens: Page path and screen class.” This section gives a nice summary of which pages are most popular with site visitors.

This advisor has blog articles that are driving more traffic to the website than the home page. These data metrics confirm that this advisor’s blog articles are an effective piece in their marketing strategy to drive traffic to their website.
Google Analytics can tell a powerful story with simple information. While this advisor thought he had a successful marketing website, in reality, we can see that only a handful of website visitors from his target market in the past month actually consumed any relevant content on his website. Now that he understands this information, he can adjust his marketing strategy and visit his Google Analytics again in a month or so to see if his new strategy is working.
Need Expert Marketing Help?
Would you like to learn more about Google Analytics for financial advisors and how that knowledge could boost your own firm’s success? Get in touch with one of our marketing strategy experts today by scheduling a free call!


